Daily Tracker to 23 April 2020

Lockdown economic data continues to show very low levels of activity. Electricity use has bounced up, partly because of cooler weather. Our index is not adjusted for temperature variations.

Our full dashboard can be seen here.

Economic monitoring is getting much better. Statistics NZ is releasing high frequency economic data here. A really great initiative. We checked out the data compared to ours, they measure similar things. For example, the daily traffic data for Auckland follows a similar pattern, but our data is more up to date.

Traffic index.jpg

Daily Tracker to 20 April 2020

Lockdown life continues in economic data.

We are using a lot more internet at home, using less electricity, travelling less, barely flying and doing less things like advertising job vacancies.

But there is encouraging sign that people are slowly thinking about the future, reflected in rising views of job ads (new chart this week; we still haven’t got a retail good spending indicator).

The full dashboard is here.

Job ad views on the Trade Me site has improved a little over the past week, as people consider life after lockdown.

Job ad views on the Trade Me site has improved a little over the past week, as people consider life after lockdown.

Daily Economy Tracker - the lockdown

We are tracking the NZ economy using daily data to understand the lockdown, the subsequent re-emergence and recovery.

Marketview electronic card transaction value.png

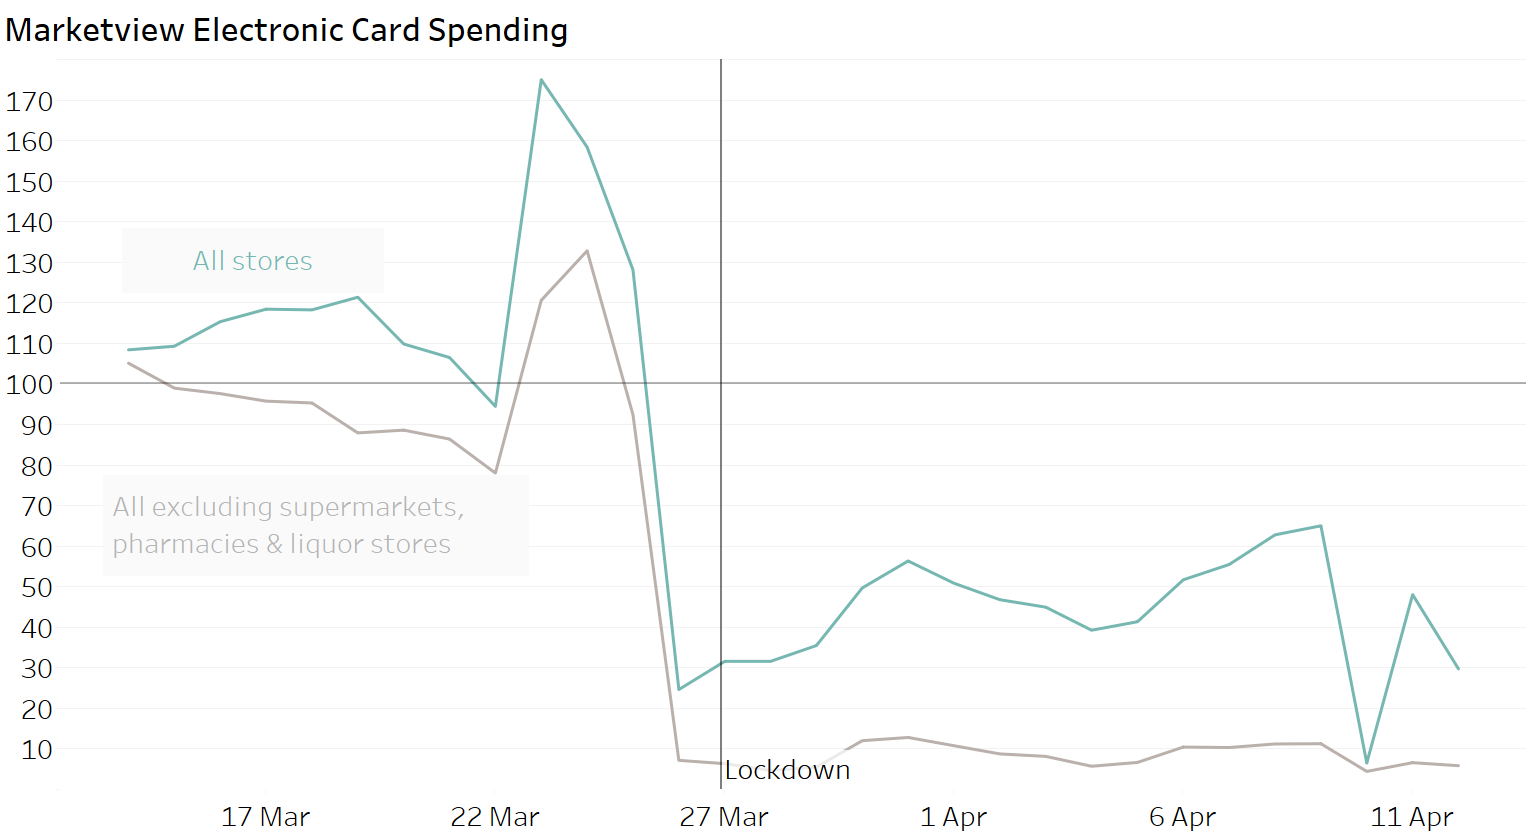
The value of electronic card transactions in retail stores is a grim measure of the immediate impact of the lockdown. The value is currently less than half the level prior to the lockdown. It is less than a tenth of the pre-lockdown level for retailers excluding supermarkets, liquor stores, and pharmacies.

We would expect retail spending to recover after the lockdown. But this indicator may also show if there are lasting impacts on spending because of job losses or changed spending behaviours.

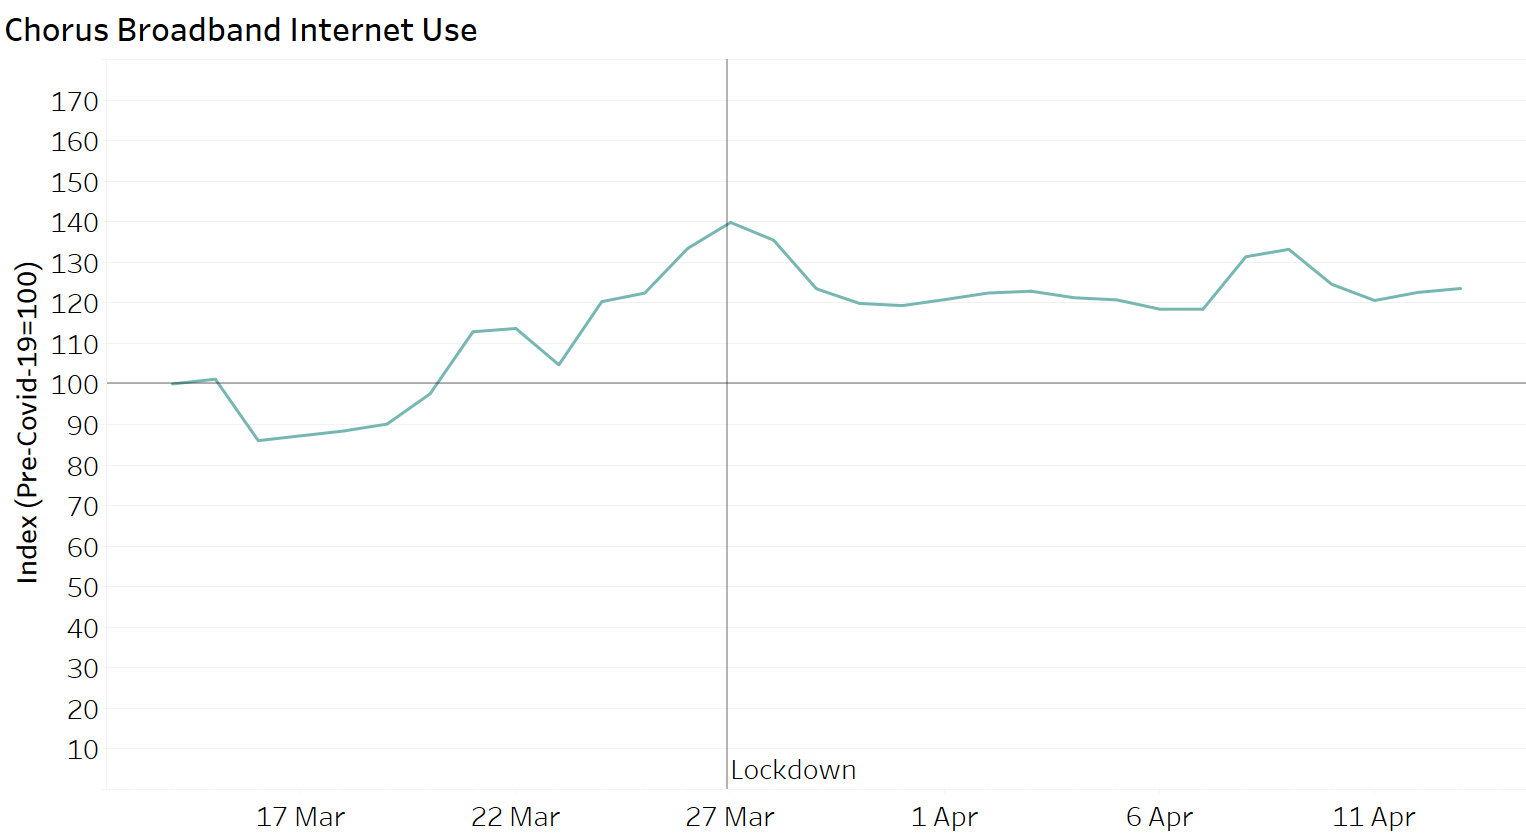
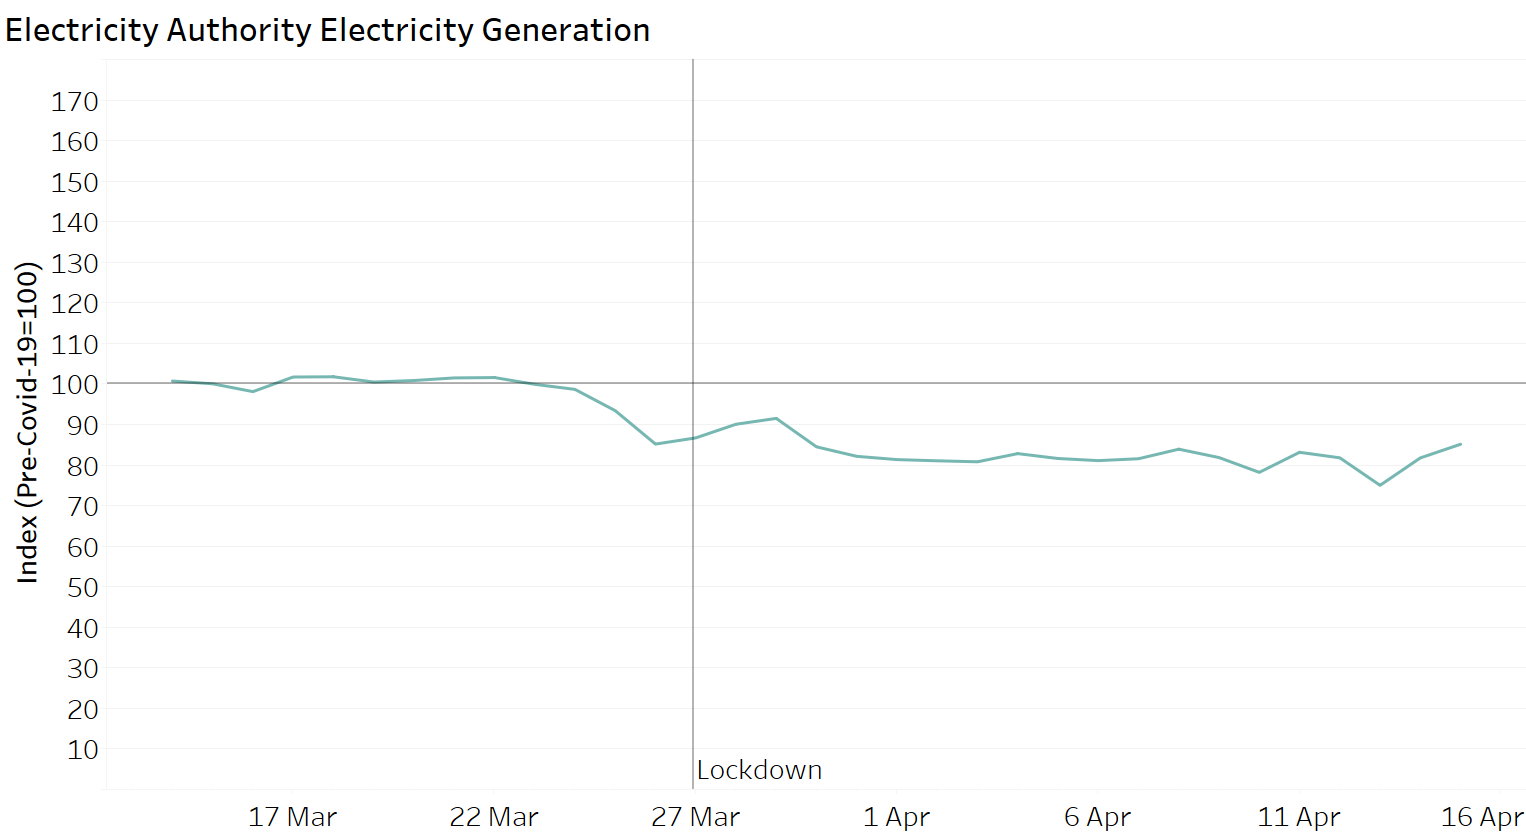
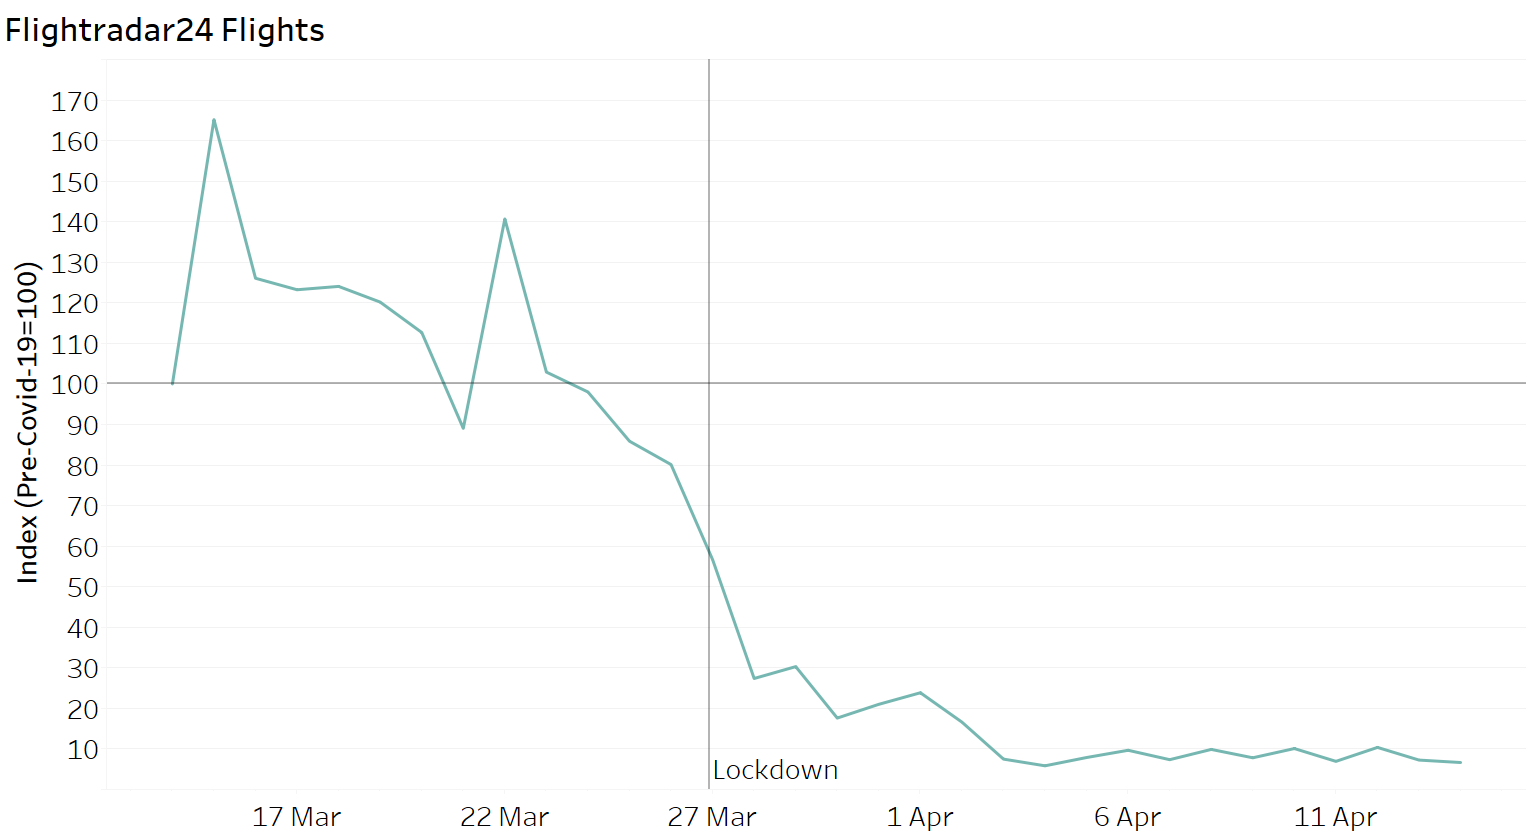
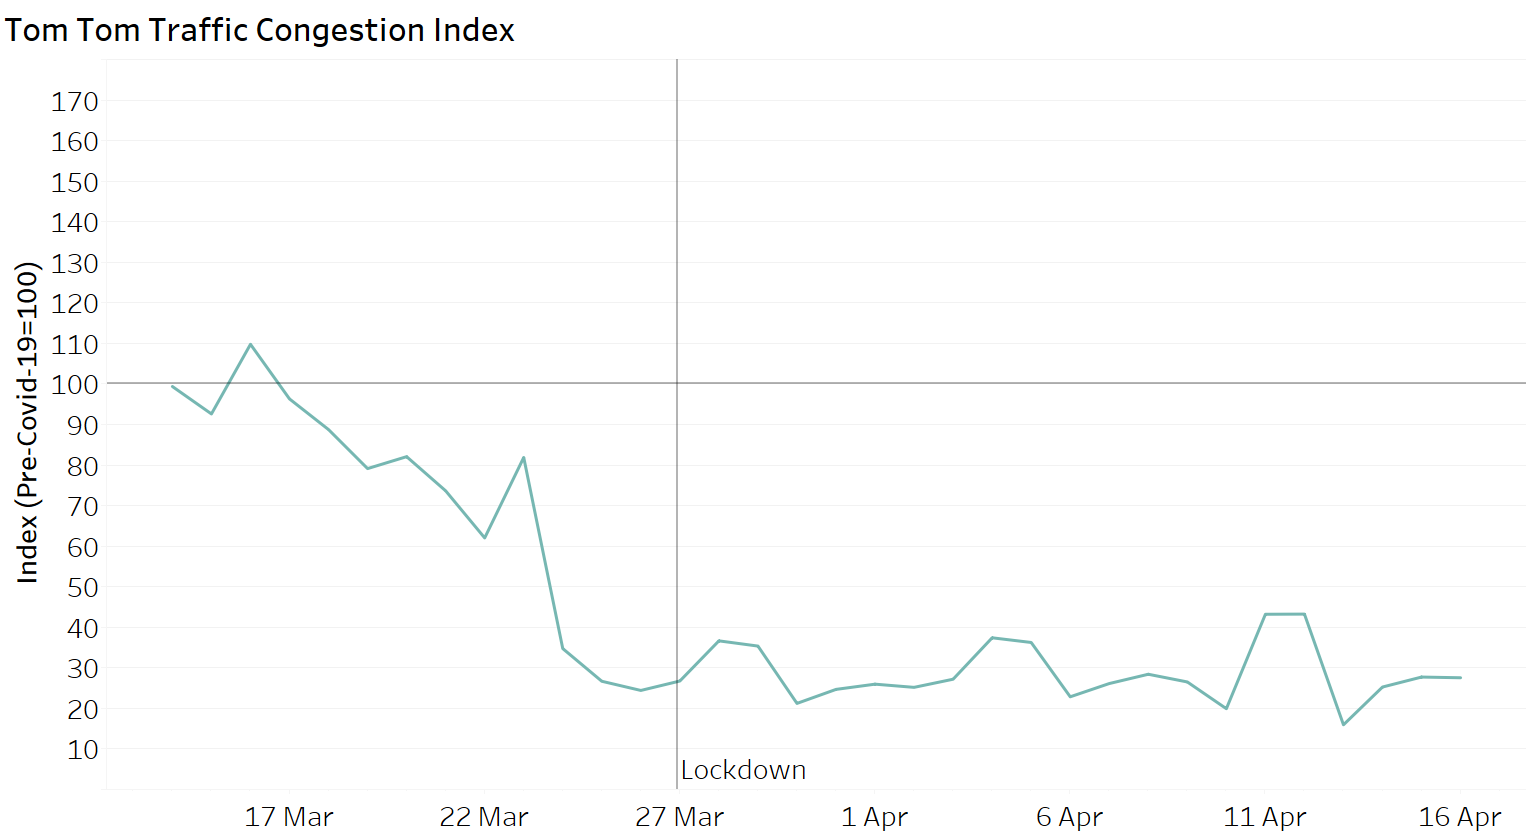
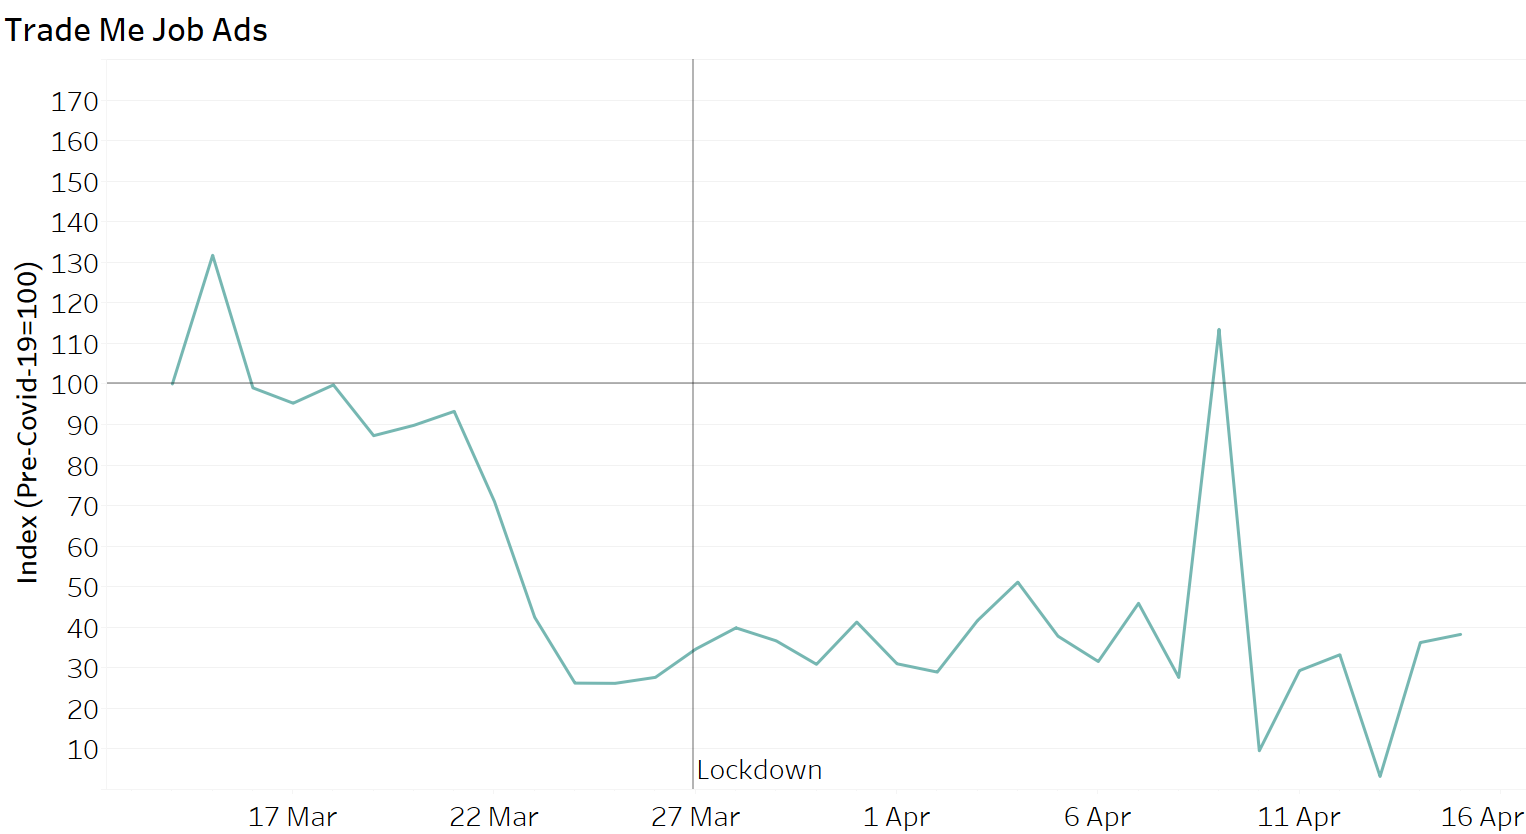
We are tracking data supplied by Marketview, Trademe and Chorus, in addition to publicly available data from Tom Tom, Flightradar24 and the Electricity Authority. 

The economic situation is changing by the day. Rather than reckons, we need to track the economy as close to in real time as possible, to both understand the health of the economy, the policy actions that may be necessary, and the effectiveness of policies implemented.

Our suite of indicators will be a useful complement to officials’ insights into jobless benefit applications, missed payments for utilities and credit relief requests, among others. 

Our first dashboard includes an explanatory note of the data and what they may tell us. We will publish an updated dashboard at least once a week during this time.